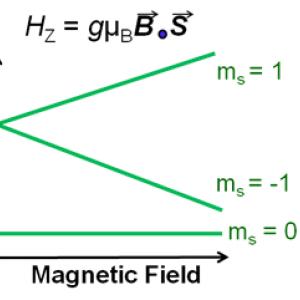
Using the spin state of nitrogen-vacancy (NV) defect centers in diamond to probe magnetic fields is an attractive prospect. The localized two electron spin triplet represents an extreme limit in scalability. The capacity for use at room temperature further demonstrates its value. The technique used here is akin to sprinkling iron filings around a bar magnet scaled down orders of magnitude. By measuring the Zeeman splitting (HZ) between the ms = 0 and ms = ±1 spin states of NV centers we can measure the local magnetic field.
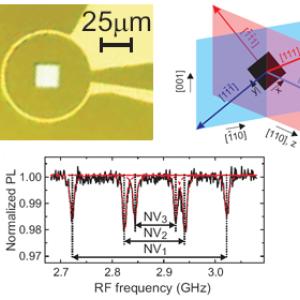
To demonstrate this technique, permalloy (Ni0.8Fe0.2) shapes (silver square in image below) were evaporated on to the surface of a diamond sample to provide a local field to probe. Microwave fields are applied through on chip circular antennas (gold in image) to drive transitions between the ms = 0 and ms = ±1 states when the field is resonant with the energy splitting. A decreased photoluminescence intensity is observed when the NV spin is in the ms = ±1 states. For the (110) diamond samples used, 2 NV’s are oriented in plain (blue in schematic) and 2 are out of plane (red). Optically detected electron spin resonance (ESR) data is taken displaying Lorentzian dips at the transition frequencies between the ms = 0 and ms = ±1 states of NV’s of each of the four tetrahedral directions.
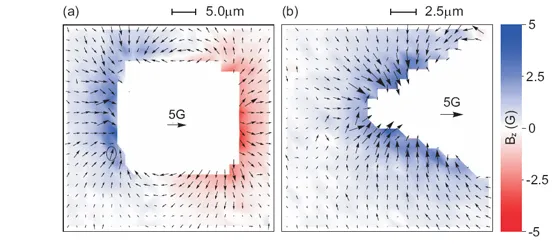
By taking ESR scans at each point on the sample, magnetic field images can be reconstructed. Below are images taken around a permalloy square and triangle. The x- and y-components of the magnetic field are depicted with the black arrows. The z-component is depicted in color scale. Each arrow corresponds to a single ESR scan.
We investigated this technique’s usefulness as a to complementary technique magneto optical Kerr effect (MOKE) microscopy. We were able to reproduce the hysteretic behavior shown in the MOKE data using our technique. It is important to note that this is a measurement of the local magnetic field due to the magnetization of the permalloy, while MOKE microscopy measures the material’s magnetization directly.
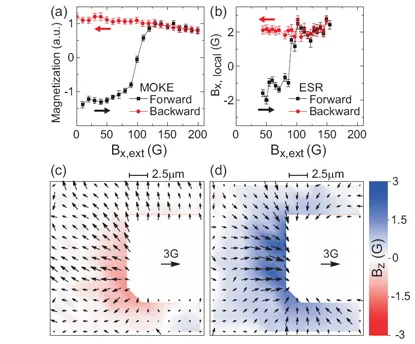
Using this technique, we were able to capture 3-dimensional magnetic field images with a lateral spatial resolution of ~0.3 μm and a field resolution of ~0.3 G. There are clear pathways to improving these values. Super-resolution imaging techniques can be used to improve the spatial resolution. Pulsed techniques can be used to improve the field resolution. This is all done in ambient conditions in low external fields of ~50 G.
To learn more about our studies, please see: "Vector magnetic field microscopy using nitrogen vacancy centers in diamond", B. J. Maertz, A. P. Wijnheijmer, G. D. Fuchs, M. E. Nowakowski, and D. D. Awschalom, Appl. Phys. Lett. 96, 092504 (2010).