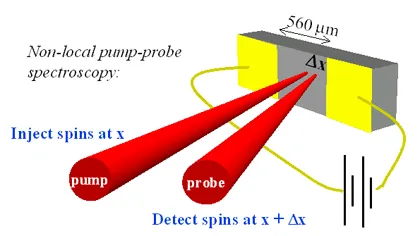
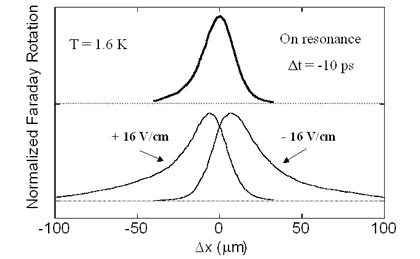
The transport of electron spin in Si-doped GaAs is achieved by moving the electrons with an in-plane electric field. As described previously, the spin dynamics are studied using the technique of time-resolved Faraday rotation. In order to observe spin transport, the probe beam is displaced from the pump beam, allowing spatial resolution of the injected spin populations as they move along the direction of the electric field. When no electric field is applied, the spatial profile of the Faraday rotation is symmetric as shown in the upper portion of the figure below. The spatial scans for an applied electric field of ±16 V/cm are shown in the lower half; the spin distribution is both laterally displaced and asymmetric.
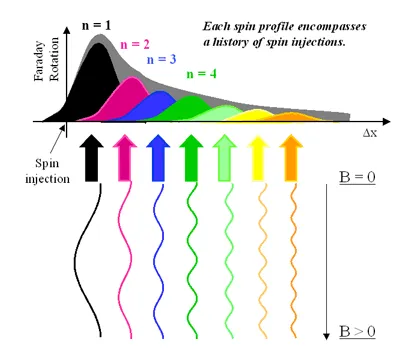
A new spin population is created every time a pump pulse hits the sample. The electrons in each new population then drift along the electric field. When observed at some time after injection, each population will have drifted an amount proportional to its age as well as experienced an exponential decay in its Faraday signal. These features produce the asymmetric shape of the spin profile seen in an applied electric field, as shown in the next figure. Spin transport can be observed at distances exceeding 100 microns.
When a magnetic field is applied to the sample the electron spins will precess around the field; each spin population will have a different periodicity.

here Δt is the time since the last pump pulse, trep is the repetition rate of the laser (13ns) and Δt + n·trep is the age of the spin population. This allows us to index the spin population by the number n. The periodicity of each spin population is represented below each of the Faraday rotation profiles in the following figure.
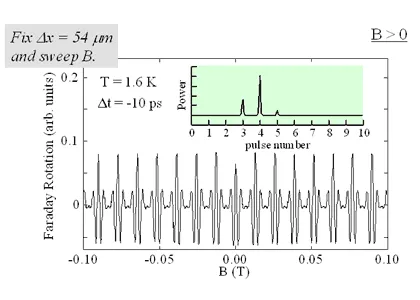
By varying the magnetic field, the Fourier components of the Faraday rotation signal can be identified. The data below shows that at a displacement of 54 μm and an electric field of -37V/cm, the oscillatory behavior of the Faraday rotation signal arises from the Larmor precession of the third, fourth, and fifth most recent pulses.
Field scans can be taken over a range of displacements in order to identify the spatial extent of each spin population and track its movement in time. Below, many field scans are combined, showing the change in the Faraday rotation (color scale) over a displacement range of -54 μm to +137 μm. At the largest displacements, the spin resonances narrow and the periodicity in the signal increases reflecting the presence of older spin populations with increasing displacement.
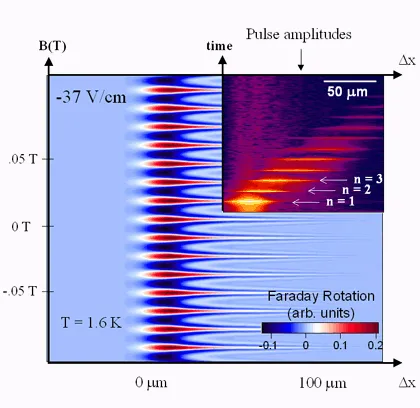
The inset shows the amplitudes of the different Fourier components on a color scale as they change with displacement and time. The ages of the different spin populations are integer multiples of the laser's repetition time. The data can clearly be used to mark the positions of individual spin packets.
For further information, see: "Lateral Drag of Spin Coherence in GaAs", Cover Article, J.M. Kikkawa, D.D. Awschalom, Nature, vol. 397, p. 139 (1999).